18.08.2025
Alkaline Water Electrolysis Beyond 3 A/cm2 Using Catalyst Coated Diaphragms
Abstract of the Paper
Alkaline water electrolysis using catalyst coated diaphragms (Zirfon UTP 500 and UTP 220) was conducted at current densities from 2 up to 3500 mA cm−2 at varying temperatures (20–75 °C) in 30 wt% KOH. The coatings were conducted using two different approaches, which were compared with each other: spray coating and stencil coating. Using platinum group free catalysts, which are either available commercially or easy to synthesize (Raney Ni; FeNi LDH), we reached 3.5 A cm−2 at less than 2.3 or 2.5 V, for Zirfon UTP 220 and 500, respectively. The improvements compared to conventional Ni felt were linked to a reduction in the kinetic overpotential due to better catalytic properties and an increase in active surface area. The internal resistance corrected potential at 1 A cm−2 was as low as 1.75 V (at 75 °C), showing that high current operation for industrial alkaline water electrolysers is possible, when ohmic resistances are adequately addressed. The catalyst coated diaphragms were stable under room temperature for at least 60 h, however, showed degradation at 75 °C over the course of up to 240 h. The catalyst layers degraded by fracturing followed by delamination to the porous transport layer, where they showed elongated stability.
Methods/Experimental
Electrolyte
To prepare the electrolyte for electrochemical measurements, KOH pellets (purity ≥88%; VWR chemicals) were dissolved in deionized water (R > 15 MΩ). The Fe concentration in the experiments was either 50 or 500 μM and fixed using Fe2(SO4)3 hydrate (≥76% purity; ≤24% H2O; Fluka analytical). This was done to obtain either comparable Fe concentration between experiments or increase the Fe concentration to see its effect on the performance, as we have proven before that higher Fe concentration may be beneficial for AWE using Ni electrodes.37
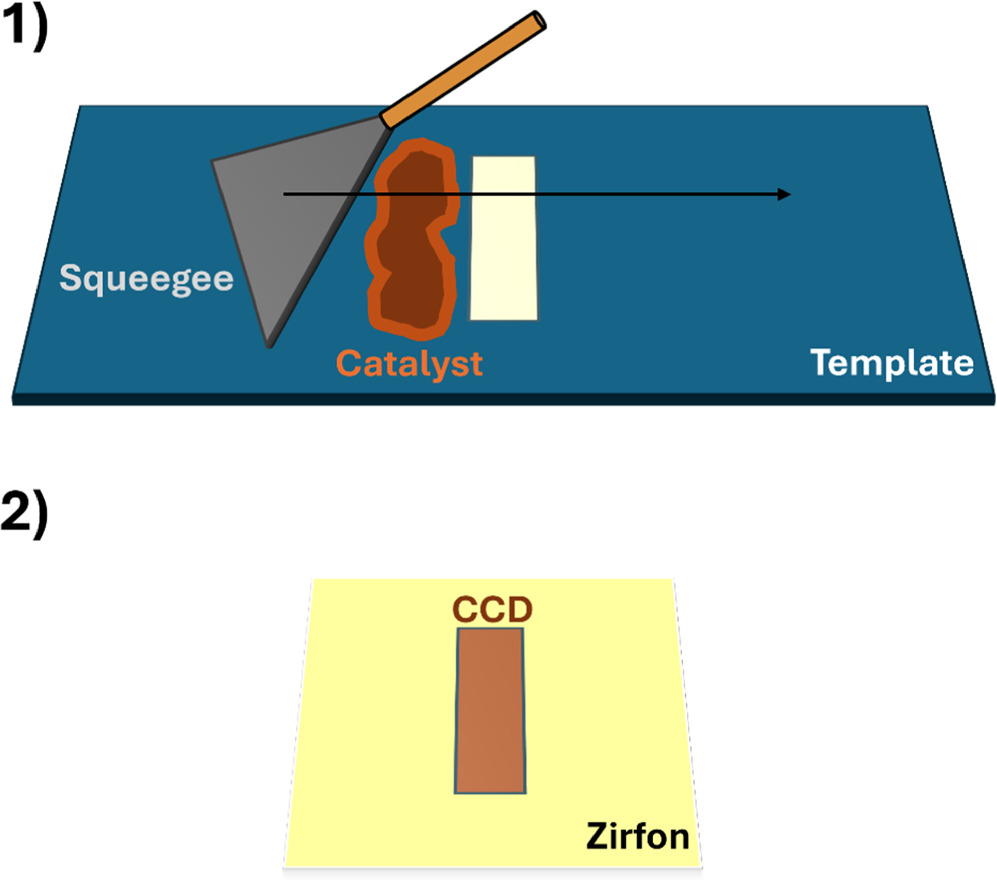
Preparation of catalyst coated diaphragms
CCDs were prepared via two different procedures: spray coating and stencil coating. For spray coating PVA was first dissolved in deionized water (10 g l−1) at 100 °C for several hours. For the FeNi LDH ink 400 mg FeNi catalyst (prepared according to 31; comparison of powder X-ray diffractograms can be seen in SI Fig. S12) was suspended in a 80 ml 50:50 volume mixture of iso-propanol and water (with 40 mg of PVA in 80 ml). For the Raney Ni ink 800 mg of Raney Ni slurry (50 wt% slurry in water; Thermo Scientific) was suspended in a 14:1 mixture of water (with 40 mg PVA in 80 ml) to ethanol. The Raney Ni was bought already activated and stabilized by a dispersant, which was washed out during the slurry preparation. The inks were thoroughly mixed in an ultrasonic bath for over an hour to increase the suspension of the ink. Afterwards the ink was sprayed onto the diaphragm which was placed on a heated plate (90 °C) and on which a spraying mask was positioned. On top of the mask a 1 cm2 reference metal plate was placed, which was also sprayed using an airbrush to determine the loading by measuring the metal plate before and after the spraying procedure. For the stencil coating procedure 400 mg of catalyst was first added to a glass vial into which 1 g of water with 10 mg PVA was added. The ink was then ultrasonicated for over an hour and placed with a dispensable pipette on a stencil coating template. The thick slurry ink was then drawn with a sharpened metal squeegee over the 100 μm thick template, which has an exposed coating area (see Fig. 1). Afterwards the CCD was dried for several hours at room temperature in a vacuum oven. The loading per side was determined by measuring the weight of the diaphragm before and after the coating and dividing the mass by coating area (2.85 cm2). For loadings of all the CCDs, we refer to Table S1 in the SI. Generally, it can be observed that stencil coating results in higher loadings than spray coating, which was expected, as stencil coating allows for lower precision of the coating procedure.

Figure 1. Scheme showing the stencil coating procedure for making catalyst coated diaphragms.
Download figure: Standard imageHigh-resolution image
Electrochemical performance tests
A 3D printed polypropylene flow cell (in-house design; see SI Fig. S1) was used for electrochemical performance tests of the CCDs. They were placed in the center of the cell and sandwiched from both sides using 500 μm or 200 μm thick Ni felts (Bekaert CURRENTO® 2NI06–0.20, Bekipor® 2NI 30–0,50; Ageom = 0.95 × 3.00 = 2.85 cm2) that functioned as porous transport layers (PTLs), for Zirfon UTP 220 and Zirfon UTP 500, respectively. We needed to adjust the thickness of the PTLs, as Zirfon UTP 220 is 220 μm and Zirfon UTP 500 500 μm thick. The total thickness of PTL and diaphragm was thus 1220 μm for Zirfon UTP 220 and 900 μm for Zirfon UTP 500, which might results in minor deviations. The current was transported to the PTLs via perforated Ni plates that were in contact with stainless steel screws. Into the screws the banana plugs connecting the potentiostat were inserted. The zero-gap cell was pressed together using screws onto which a torque of 2.5 N·m was applied. As a potentiostat a Vertex 10 A (Ivium Technologies) was used and connected to the cell in a 4-terminal connection.38
The cell was connected to the jacketed glass gas-liquid separators using C-flex Ultra Masterflex tubing. The outer jacket of the gas-liquid separators were connected to a thermostat (Brinkmann MGW Lauda C6 and Brinkmann MGW Lauda R22; CS control units) to allow for temperature control of the electrolyte. Throughout all the experiments, the gas-liquid separators were flushed with N2. The separated gasses were led to cooling columns to condensate evaporated water and finally passed through gas scrubbers to clean off residue KOH. The catholyte and anolyte streams were then mixed with each other before entering the pump (Allied Motion, Bedu Pompen, flow rate = 9 ml s−1; residence time per half-cell = 1.5 s) and led back to the electrolysis cell. A thermocouple was located before the cell inlet to monitor the electrolyte temperature via the potentiostat. The thermostat temperature was set to 20, 50, and 85 °C resulting in averaged measured inlet temperatures of 21.5 ± 1.9, 50.6 ± 3.4, and 76.0 ± 2.5 °C (̅ ± 2σ; standard deviation), over all experiments performed.
For electrochemical performance assessment the cell was first conditioned by stepping the current density from 2000 mA cm−2 to 80 mA cm−2 and back to 2000 mA cm−2 using 60 s per step. Following, chronopotentiometry (CP) and electrochemical impedance spectroscopy (EIS) measurements were performed from 3500 mA cm−2 to 2 mA cm−2 using a 10% current amplitude. The potentials for the polarization curves were determined by taking the average of the last 10 s of the 60 s CP measurements. The ohmic resistances were determined via the high frequency resistance of the EIS measurement using a R(RQ)(RQ) equivalent circuit that was fitted with IviumSoft (Ivium) or impedance.py (Python module by Murbach et al.39). At each temperature four to six sets of measurements per electrochemical protocol were performed to obtain representative data.
Results/Findings
All CCDs were measured in a flow cell at temperatures between 21.5 to 76.0 °C and had an electrode area of 2.85 cm2. The cell design was optimized so that we achieve a zero-gap in order to reach high current densities.40 We added Fe to the electrolyte to simulate conditions in a conventional stainless steel electrolyser (sub to low ppm range) and to prevent Fe leaching from the FeNi LDH catalyst. In Fig. 2 and SI Fig. S2 we can observe the corresponding polarization curves. Using Raney Ni and FeNi LDH as a catalyst we substantially reduced the potential by 300 mV at 21.5 °C and by 230 mV at 76.0 °C compared to the nickel felt benchmark. This allowed us to reach 3.5 A cm−2 at just over 3.08 V (21.5 °C) and at 2.47 V (76.0 °C). We then performed a similar CCD approach using Zirfon UTP 220, which is considerably thinner than Zirfon UTP 500. Thus, the ex situ resistance of Zirfon UTP 220 is lower than for Zirfon UTP 500 (ionic resistances at 80 °C of 0.05 and 0.10 Ω·cm2, respectively).41 To make sure a zero-gap configuration is still achieved, we used 500 μm thick Ni PTLs (instead of 200 μm thick Ni PTLs). Thus, we reached 3.5 A cm−2 at 76.0 °C at less than 2.3 V using FeNi-LDH and Raney Ni CCDs (330 mV improvement vs the Ni felt and Zirfon UTP 500 benchmark), showing that we managed another 100 mV reduction in cell potential due to a lower ohmic resistance. We also tested Raney Ni coatings on both sides of the Zirfon UTP 220 diaphragm, which resulted in a 220 mV improvement vs the Ni felt and Zirfon UTP 500 benchmark (see SI Fig. S3). This means it performed better than only using Ni felt, however, worse than using a FeNi LDH CCD on the anode site.
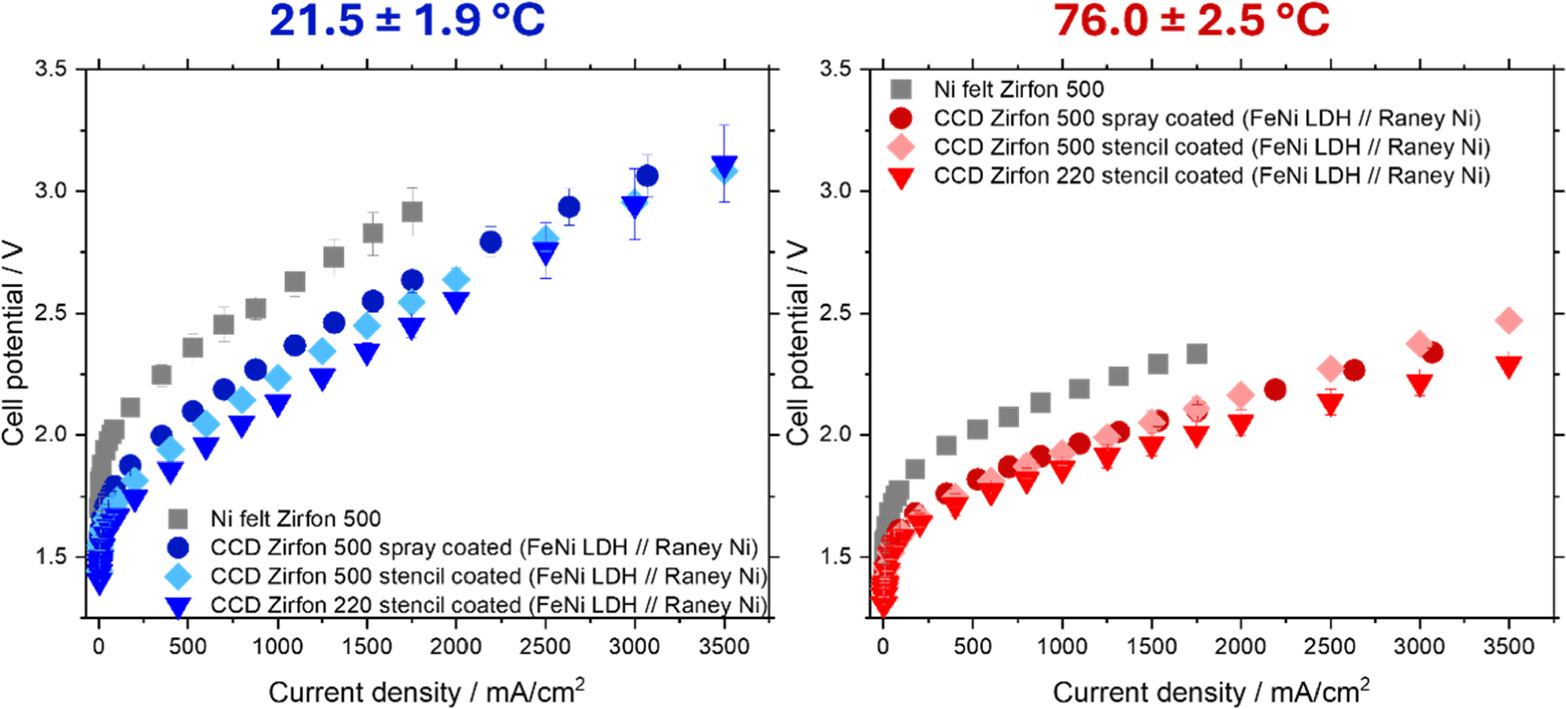
Figure 2. Polarization curves obtained for benchmark Ni felts and Zirfon UTP 500, compared to catalyst coated diaphragms (Zirfon UTP 220 and 500) at varying temperatures in 30 wt% KOH. 50 μM Fe concentration was used in the stencil coated CCD experiments, while a 500 μM Fe concentration was used for the spray coated CCD.
Access the full research paper HERE
Credit authorship contribution statement
Maximilian Demnitz*, John van der Schaaf and Matheus Theodorus de Groot
Published 14 January 2025 • © 2025 The Author(s). Published on behalf of The Electrochemical Society by IOP Publishing Limited